With the release of DomotiGa v1.0.020, it is now possible to use SmartVISU plot charts directly instead of importing a 3rd party tool like HighCharts (see previous article about HighCharts).
Notes:
- Make sure you use the correct DomotiGa drivers for SmartVISU (you can get them here: io_domotiga.js and io_domotiga.min.js)
- If not yet done, you’ll also need to ensure you are tracking the value changes by enabling Log value history to database under the Options tab
- Name your device values correctly: the device name ideally has no spaces, the datasource name will be made of devicename_plotx where x is the device’s value (1 to 4). In my example, HDDRoot is the name, the Hard Drive’s temperature is in value1 so the datasource name is hddroot_plot1:
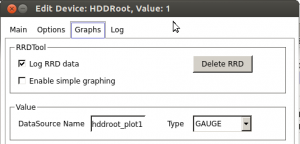
datasource name
- Use this command in your SmartVISU page:
-
{{ plot.period('plot1', 'HDDRoot_Plot1', 'avg', '1w', '', '', '', '', 'HDD Root', '#ff0', 'line', ['','°C'], '1h')}} - Explanation of what each parameter means is provided by SmartVISU HERE

The result of my setup is this:
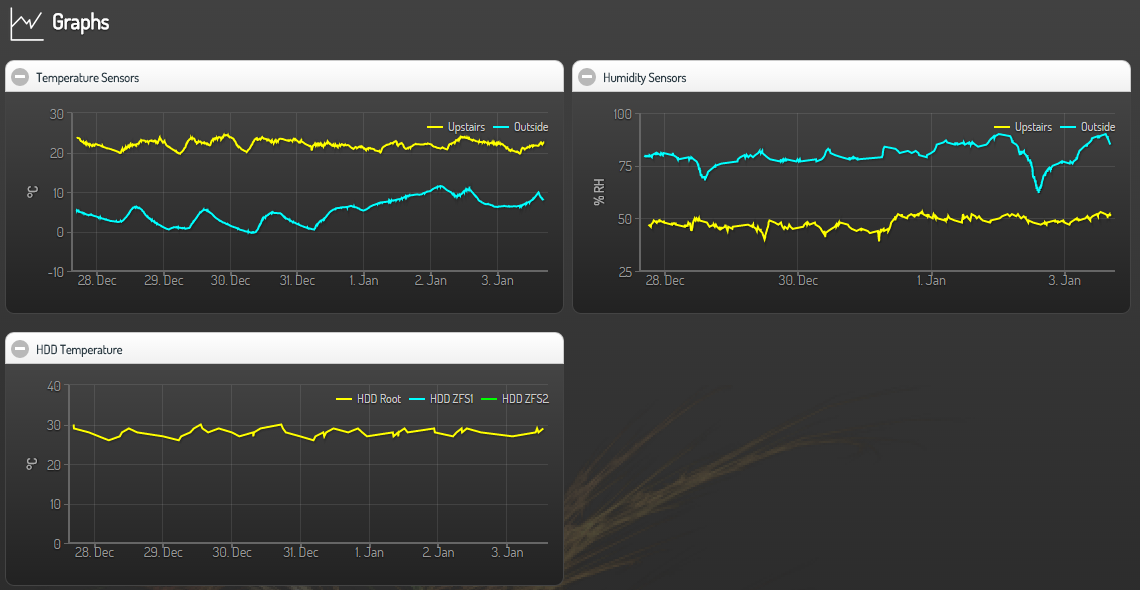
SmartVISU Plots
Note: I just added 2 hard drives to my server for storage and backup purposes (see this article), so there has not been enough time yet to track their temperature changes in the above charts.