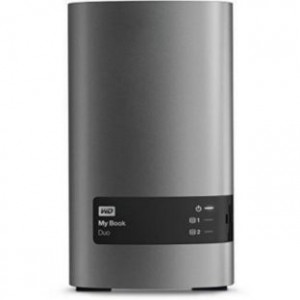
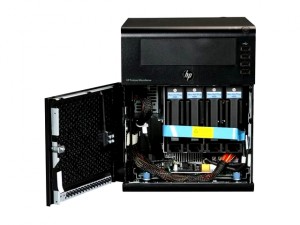
As my HP N54L server has 4 hard drive bays, I’ve been waiting for a good deal to add hard drives and expand my storage. Following a special offer at Argos (£99 instead of £249 😎 ), I purchased a WD 4TB My Book Duo Desktop USB Hard Disk Drive:
The idea was to take the hard drives out of the box and fit them in the server:
I originally wanted to set them in RAID1 (mirrored) for additional data protection, it turns out that the RAID1 feature on the Bios is not compatible with Ubuntu.
I therefore decided to use ZFS which although a bit slower, would actually be more powerful than RAID1 due to its self healing functionality.
This is what I did to set it up:
sudo add-apt-repository ppa:zfs-native/stable
sudo apt-get update
sudo apt-get install ubuntu-zfs
It is better to set it up by using the hard drive ID rather than name. the below command will give you what you need
ls -l /dev/disk/by-id
Once I have the names of the drives, I uses the below command to create the zfs pool. (Don’t start copying files into it yet until ZFS file systems are created:
sudo zpool create -o autoexpand=on myzfs mirror /dev/disk/by-id/disk1 /dev/disk/by-id/disk2
I then created a separate file system for each of my top-level folders:
sudo zfs create -o compression=on myzfs/folder1
I created “Backup”, “Movies”, “Music”, “TV_Shows”, “Pictures”. They show up in Ubuntu’s file system as /myzfs/Backup, /myzfs/Movies, /myzfs/Music, /myzfs/TV_Shows, etc.
I’ve chosen the latter folder names as I’ll be using them for Plex
Thanks to whirlpool.net.au for the instructions on how to set up ZFS.


