Following what I think is due to a general OS update, SmartVISU no longer connects to DomotiGa. I’ve tried to fix it, but I’ve thought for a while now to transfer everything over to Home-Assistant since support for IoT devices is much better and update are a lot more frequent
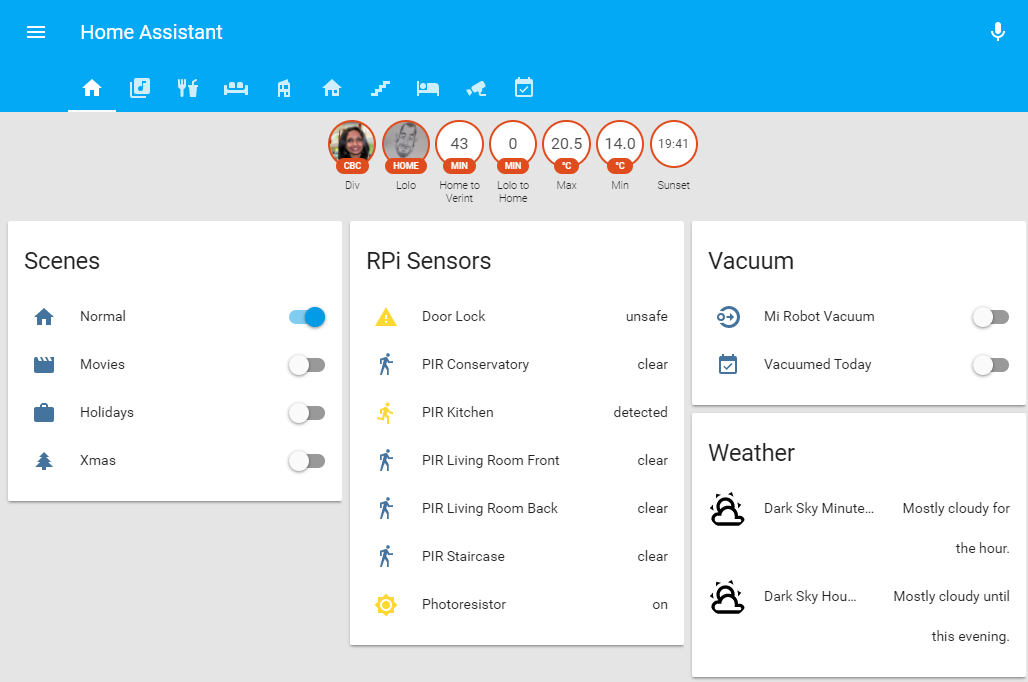
So I’ve finally taken the plunge. One of the main hubs that was used in DomotiGa was the RFXTrx433 Transceiver. I’ve disconnected it from DomotiGa and added it to Home-Assistant. I’ve spend the best part of 2 weekends and several weekday evenings recreating the devices and events that were in DomotiGa.
There’s still a lot of work to be done, but I’ve done the most important bits. I’ve also broken down the content on several pages unlike cramming almost everything in one page like I did in SmartVISU.
I’ve also used this an opportunity to save my config to GitHub for back up and in case it helps someone else.
The only thing I’ll be missing as not built-in is the data from my CurrentCost Sensors, but I’ll be running a light version of DomotiGa to send that data to my Home-Assistant setup.
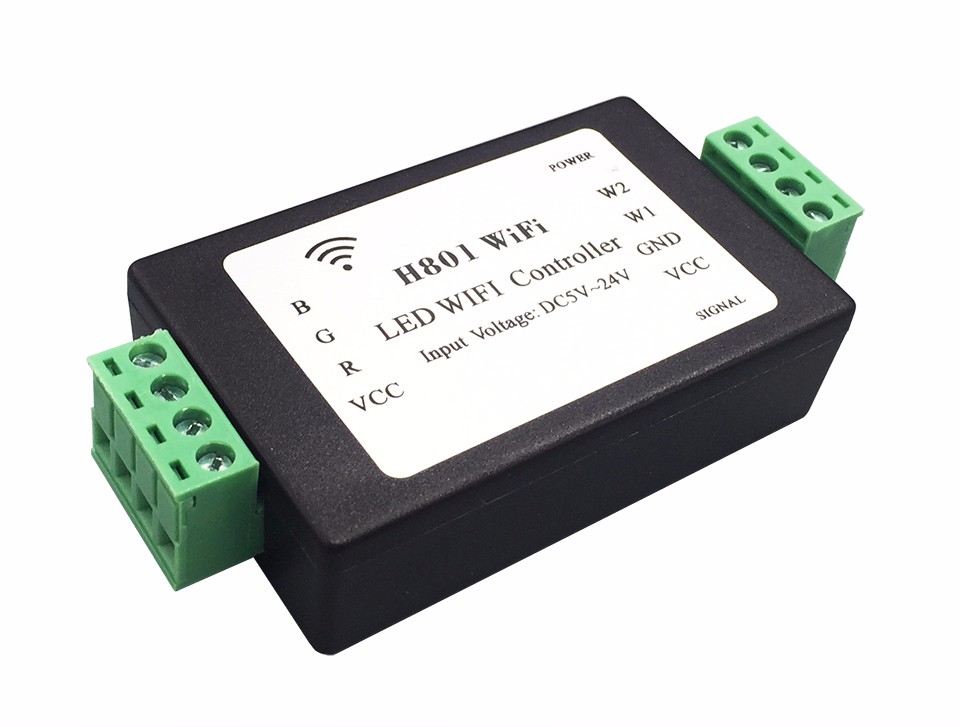
Note: I only soldered the RGB and Vcc pins as I’m not looking to use the white channels, hence the hard coded 0000 in the above script
All I need to do now to change the colour [to purple on the 1st controller) is to call the script as follows:
LEDStrip 1 255 0 255
Now to take it to the next level, I created a separate script to slowly run through the colour spectrum. I mainly run it at Christmas so called it LEDStripXmas.py (hence the command in previous script to kill this one if running):
#!/usr/bin/python
# -*- coding: utf-8 -*-

import time
import sys
import subprocess

LEDStripBase="echo PASSWORD | sudo -S sendip -p ipv4 -is 192.168.0.24 -p udp -us 30978 -ud 30977 -d 0xfbeb"
LEDStrip1="000063509900 -v 192.168.0.40 > /dev/null"
LEDStrip2="000091559900 -v 192.168.0.41 > /dev/null"

colors=[255,0,0]
while(True):
	# Cycle through RGB Spectrum
	colors[0]=255
	colors[1]=0
	colors[2]=0
	for decColour in range(0,3,1):
		if(decColour == 2):
			incColour = 0
		else:
			incColour = decColour + 1
		for i in range(0,255,1):
			colors[decColour] = colors[decColour] -1
			colors[incColour] = colors[incColour] +1
			R = hex(colors[0])[2:]
			if(len(R)==1):
				R = "0" + R
			G = hex(colors[1])[2:]
			if(len(G)==1):
				G = "0" + G
			B = hex(colors[2])[2:]
			if(len(B)==1):
				B = "0" + B
			if(sys.argv[1] == '1'):
				cmd = LEDStripBase + R + G + B + LEDStrip1
			else:
				cmd = LEDStripBase + R + G + B + LEDStrip2
			ps = subprocess.Popen(cmd, shell=True)
			time.sleep(0.1)
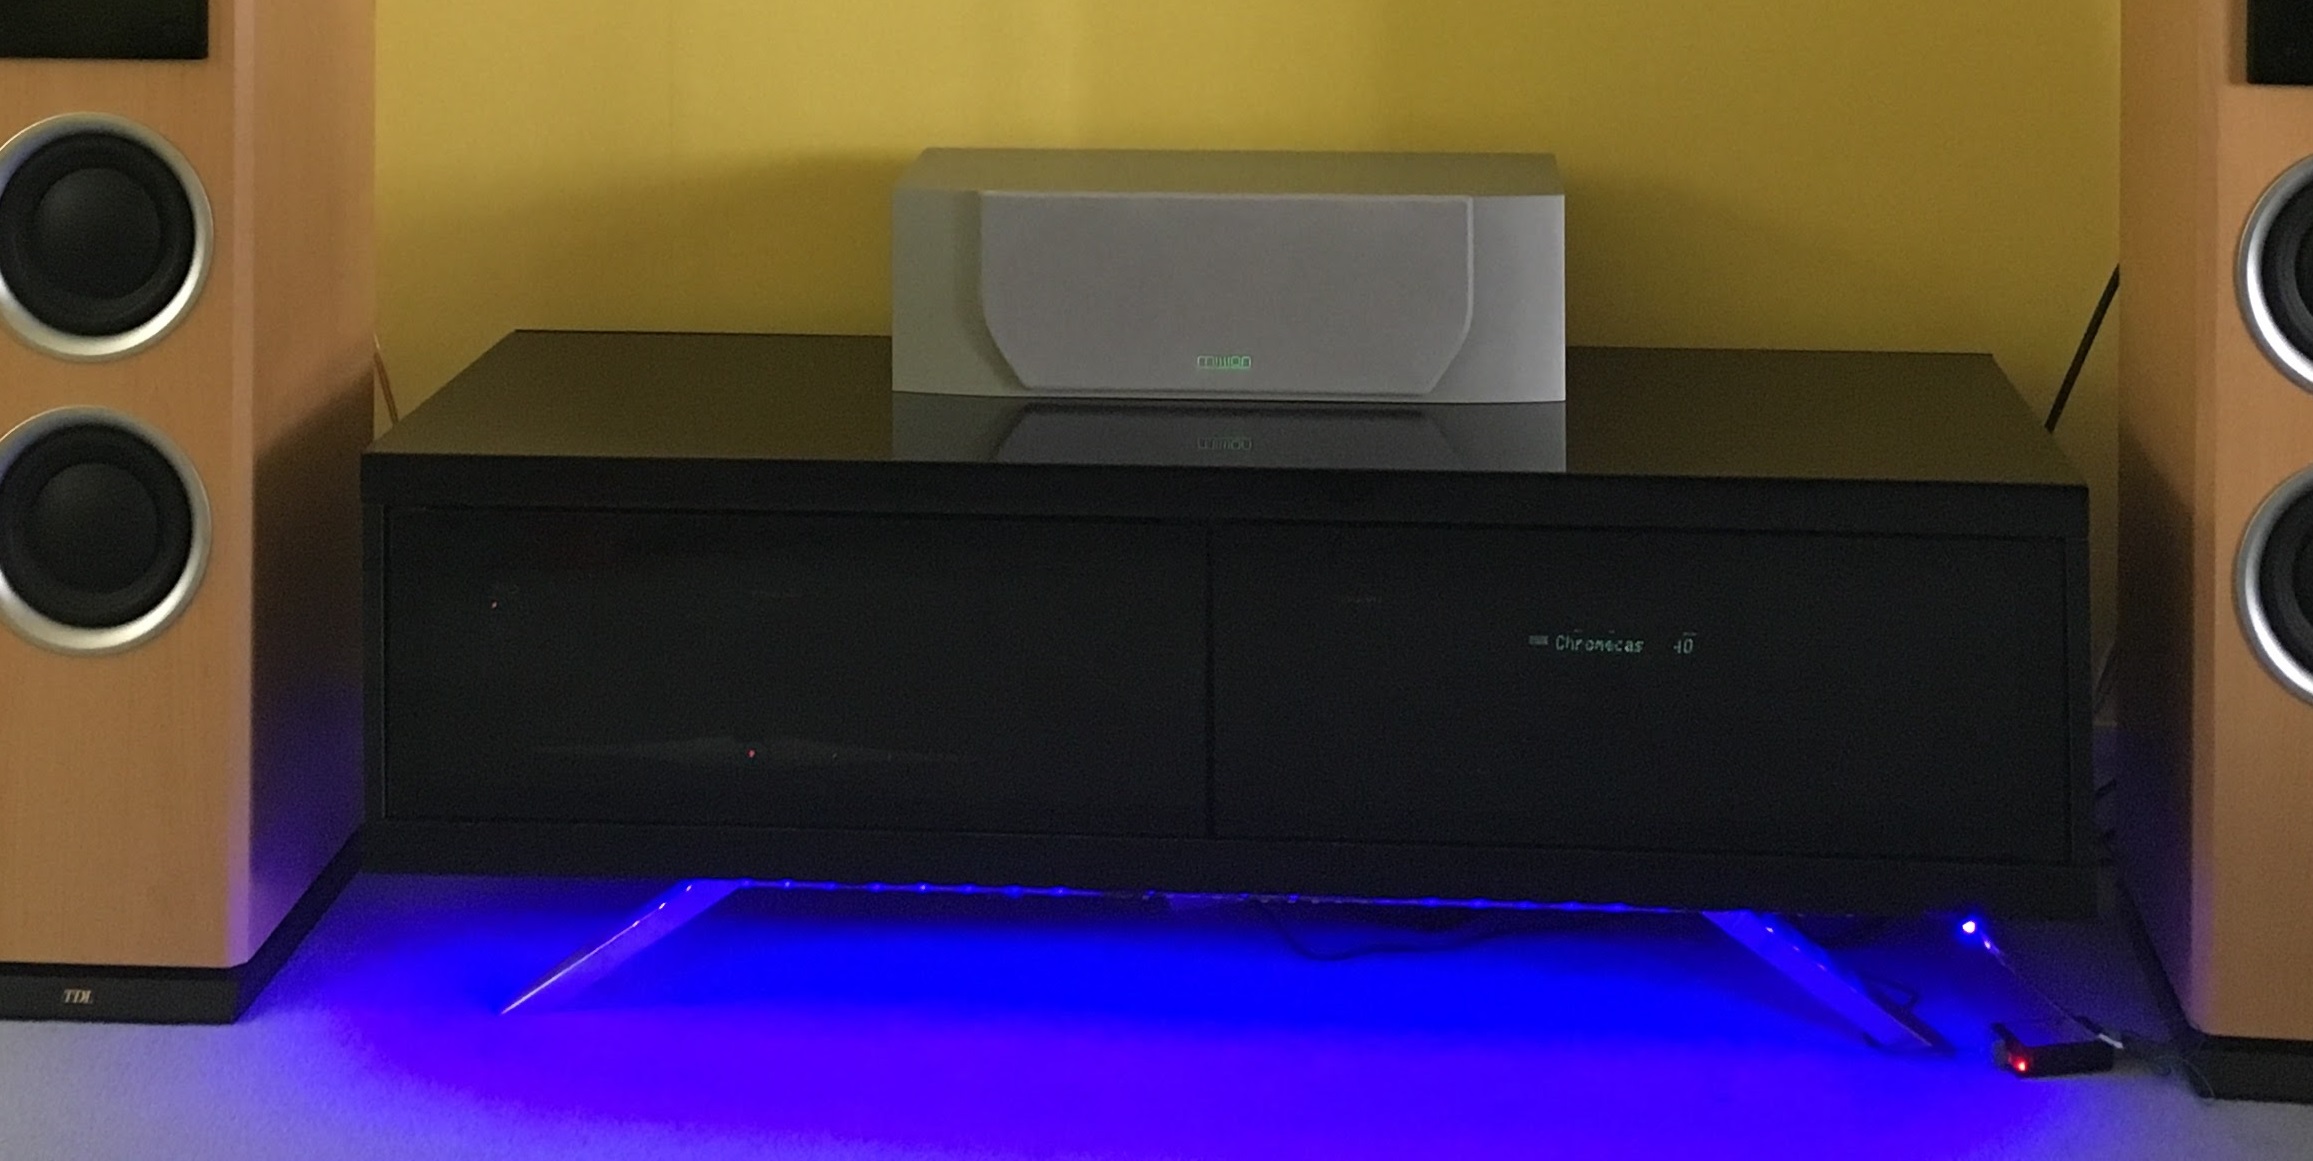
For the below movie, I’ve reduced the wait time (normal cycle takes about 1 min)
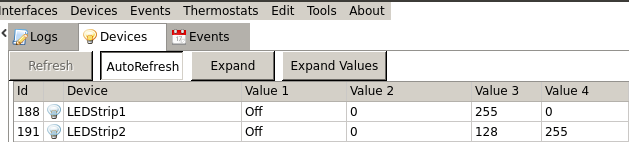
I then added the strips as devices in DomotiGa.
They are added as virtual devices, with Value1 being the strip’s status (on|off) and values 2,3,4 carrying the decimal value of the R G B colours respectively:
LED Strips – DomotiGa
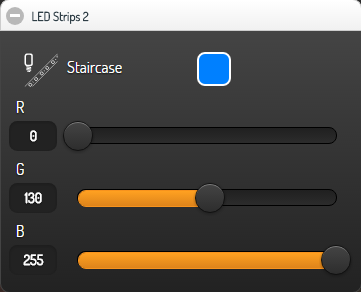
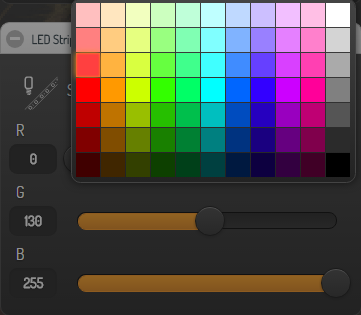
Then all I had to do is to call an action when one of the values of the device changes:
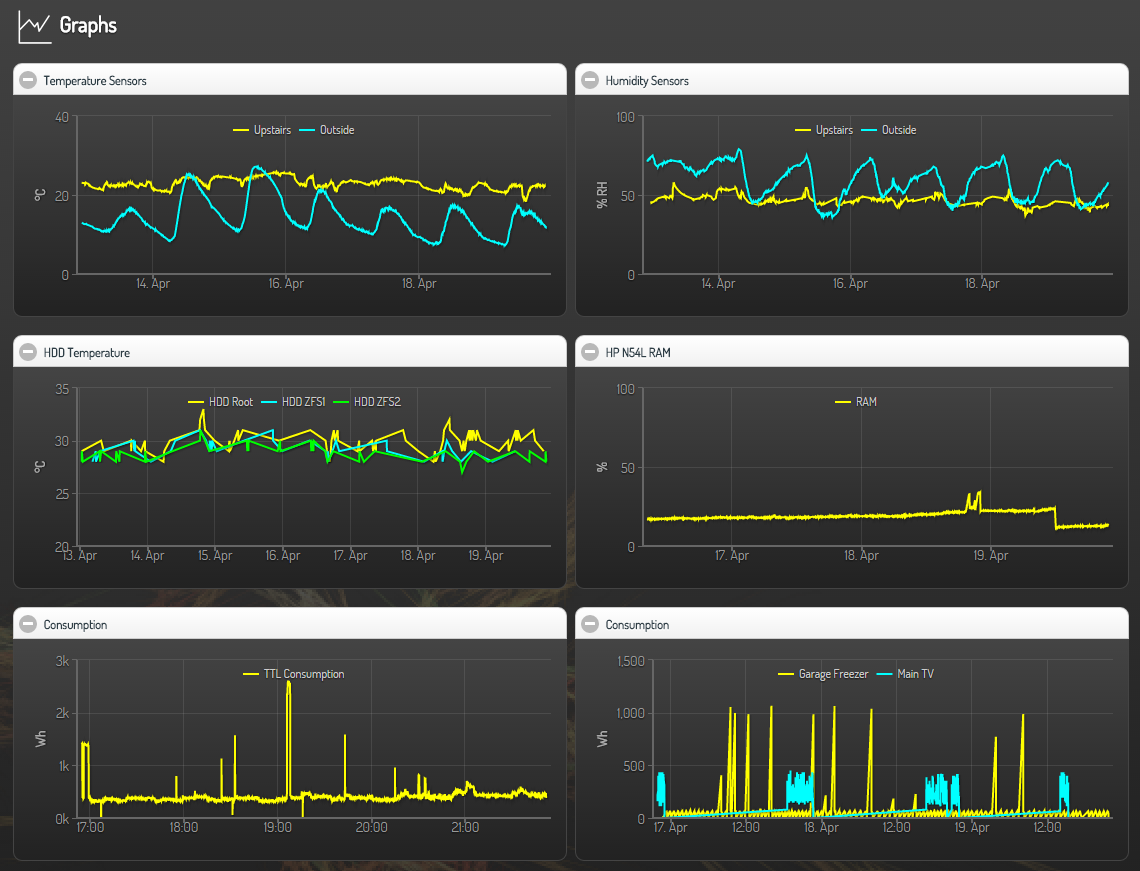
DomotiGa was upgraded over the Easter weekend as well as a new version of SmartVISU bringing an improvement on plots.
Whereas before the plot function would pull the complete list of values to build the chart (and therefore would just time out, especially with my CurrentCost power consumption as it updates every 5 sec), the revised version has a new parameter for the maximum number of points to return.
This means I can now plot ANY of my devices’ values:
The easiest way to know where to put that new value (mine’s set to 2500 as any higher seems to time out) is to open widgets\plot.html
/**
* A simple widget for plotting charts
*
* @param unique id for this widget
* @param series of item/s. More item/s in array form: [ item1 , item2 ]
* @param the mode: 'avg', 'sum', 'min', 'max'
* @param the minimum time (x-axis): '1h', '2h'... (duration-format)
* @param the maximum time (x-axis): '', '1h', '2h'... (duration-format, default: now)
* @param the minimum y-axis (optional)
* @param the maximum y-axis (optional)
* @param the number of points in the period
* @param label/s for each series (optional)
* @param color/s for each series e. g. '#f00' for red (optional, default: sutiable for design)
* @param type/s for each series: 'line', 'stair', 'spline', 'area', 'areaspline', 'column' (optional, default 'line')
* @param title/s for the x-axis and y-axis
* @param minimum time while zooming in sec (optional, duration-format)
* @param number of samples (points) (optional, default 100)
*
* @see misc/fundamentals#Array-Form
* @see misc/fundamentals#Duration-Format
*/
On 17th November 2014, Google closed its V1 and V2 APIs:
“The Google Calendar API moved to version 3 months ago; however, many developers have continued to hang on to v1 and v2 integrations. In less than a month, on Nov. 17, Google will shut down v1 and v2 in accordance with itsDeprecation Policy. Google has published an entire Migration Guide to assist developers’ transition, and many third-party solution providers have released packages to further streamline the process.”
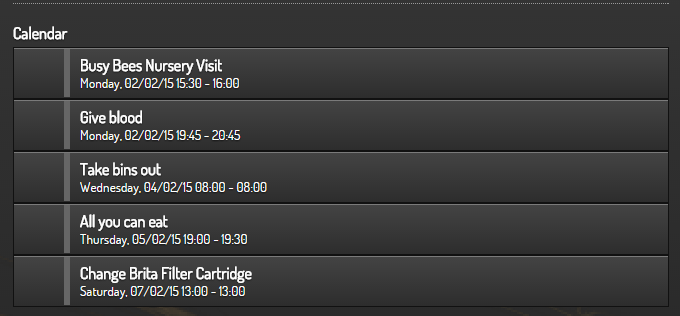
This meant that the Calendar widget on SmartVISU was no longer working.
CarGo kindly created a guide on how to create a V3 API so the calendar would work with SmartVISU.
Trouble is, CarGo wrote it in German, so I’ve translated it below. It may sound complicated, but then it’s only required once 🙂
Create a “Project” -> You can simply enter “Project API”, unless you’re planning on creating many APIs / Apps, it does not matter at this stage
On the left menu, select “APIs” then “Calendar API” on the main page.
On the left menu, select “Credentials” then click on “Create new Client ID”
Important: Select “Installed applications”, NOT Web Application – otherwise you’ll have to grant access each time in a pop-up…
On the left menu, select “Consent screen”. The main info to provide here is the Product Name. I called mine SmartVISU.
Select “Installed Application” then “Other” for application type, and finally “Create Client ID” .
Now under “Credentials” from the left menu, “Client ID”, “Client Secret” and “Redirect URIs” are displayed. We’ll need these in the next steps
The access details are now configured. The trick is to create an “Authorization Code” and “Refresh token”.
To do so, download Google_Calendar_SmartVISU.zip and extract it in “[path]/smartvisu/lib/calendar/service”. (Replace [path] with the path to access your SmartVISU folder)
Make sure the file owner is www-data else you’ll get errors. To make www-data the owner, simply enter the below in a terminal:
Getting the “Authorization Code” and “Refresh token”:
Enter the values for “ClientID” and “redirect URI” in “google_1.php”
Paste the below command in the terminal
php -q google_1.php
Click on the link in the terminal (you may need to hold CTRL while you click)
Confirm you want to grant access to your Google Account
Copy the “Authorisation Code” displayed
Enter the values for “ClientID”, “Client Secret”, “redirect URI” and the code copied from above step in “google_2.php”
Paste the below command in the terminal
php -q google_2.php
Keep note of the provided “Refresh Token”.
Edit “googleV3.php” and replace the blanks for:
“ClientID”
“Client Secret”
“Redirect URI”
“Refresh Token”
Last but not least, edit config.php in your main SmartVISU folder and add replace your google calendar line with the new script:
define('config_calendar_service', 'googleV3');
Save, Et Voilà !
Massive thanks to CarGo for the original work and guide.
Google Calendar Widget V3 API
PS. There may be a need to refresh the token in the future. I’ll post an update as and when it occurs. If this happens, Ideally the refresh should be automated, but that’s a story for another time 😉
With the release of DomotiGa v1.0.020, it is now possible to use SmartVISU plot charts directly instead of importing a 3rd party tool like HighCharts (see previous article about HighCharts).
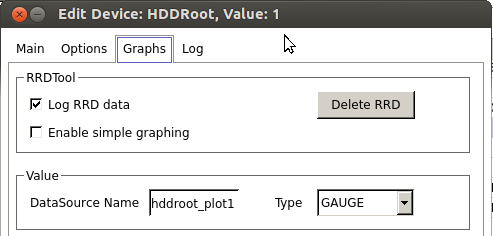
If not yet done, you’ll also need to ensure you are tracking the value changes by enabling Log value history to database under the Options tab
Name your device values correctly: the device name ideally has no spaces, the datasource name will be made of devicename_plotx where x is the device’s value (1 to 4). In my example, HDDRoot is the name, the Hard Drive’s temperature is in value1 so the datasource name is hddroot_plot1:
Explanation of what each parameter means is provided by SmartVISU HERE
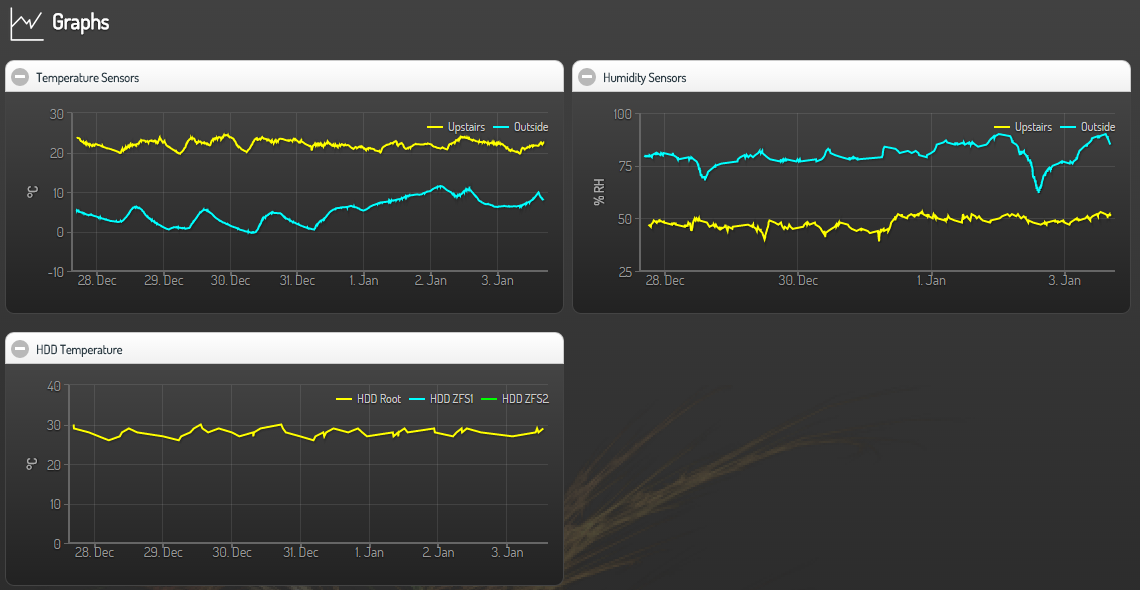
The result of my setup is this:
SmartVISU Plots
Note: I just added 2 hard drives to my server for storage and backup purposes (see this article), so there has not been enough time yet to track their temperature changes in the above charts.
Having moved one of my PIR‘s in the living room to automate the lights in here too, I quickly realised there was a major flaw: when I watch the TV, I tend to move very little. This results in the lights turning off when I want them to stay on.
I had to find a better solution than waving my arms every 5 min or so to keep the lights on.
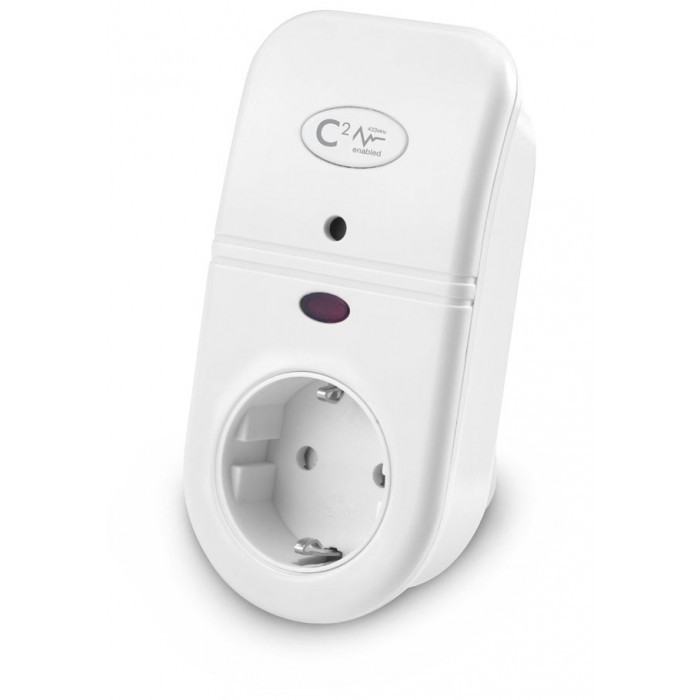
I found out Current Cost do IAMs or Individual Appliance Monitors. They look like this (I ended up with a European version with a couple of adapters to get it to work here in the UK):
Current Cost IAM
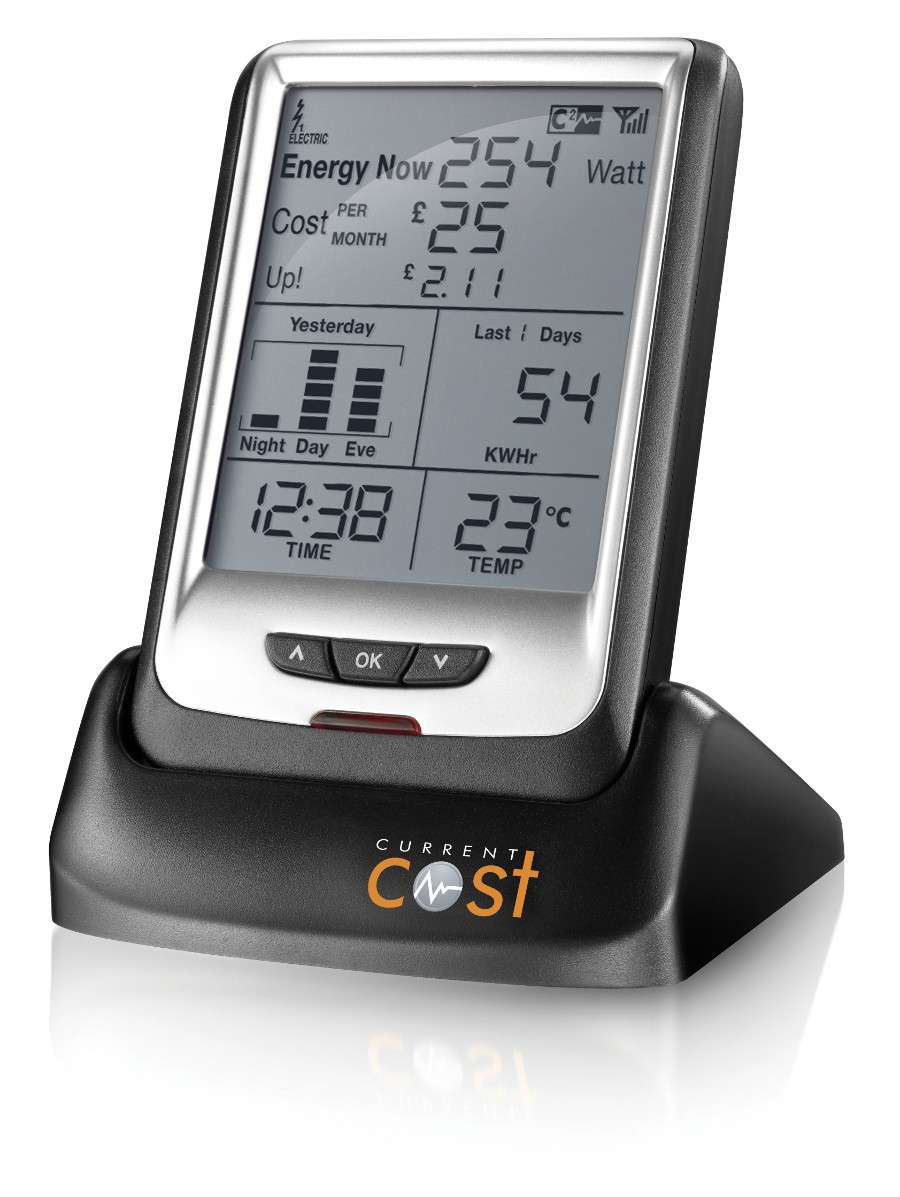
Since my Current Cost Classic monitor did not support this, I bought a 2nd hand one that does from eBay: the EnviR:
Current Cost EnviR
The neat result is that the IAM, although not natively supported by DomotiGa (at the time of writing), is actually correctly detected since Current Cost use the same format on the serial port 🙂
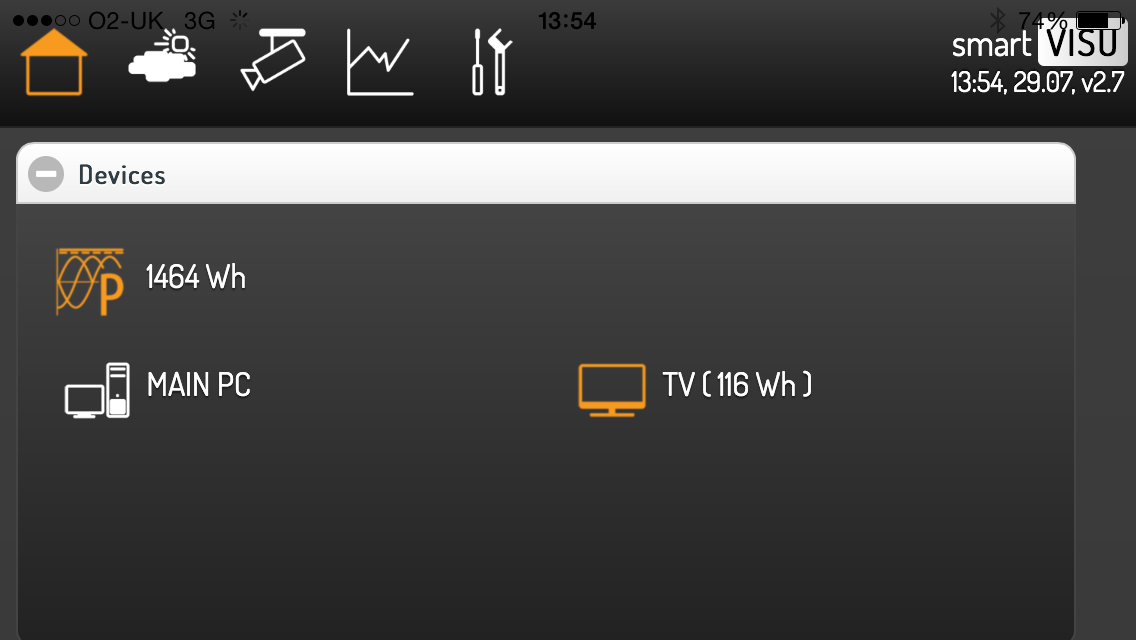
It was then very simple to add an event in DomotiGa to check IF there is no motion detected on the PIR AND the power consumption of the TV is less than 20 watts (the TV uses about 12-14watts in standby), THEN I switch the light off.
SmartVISU – TV Monitor (screenshot from mobile interface)
For the record, the Current Cost returns a string, not a number, in the format ‘00000‘, so in DomotiGa I had to convert this to a number for my IF statement:
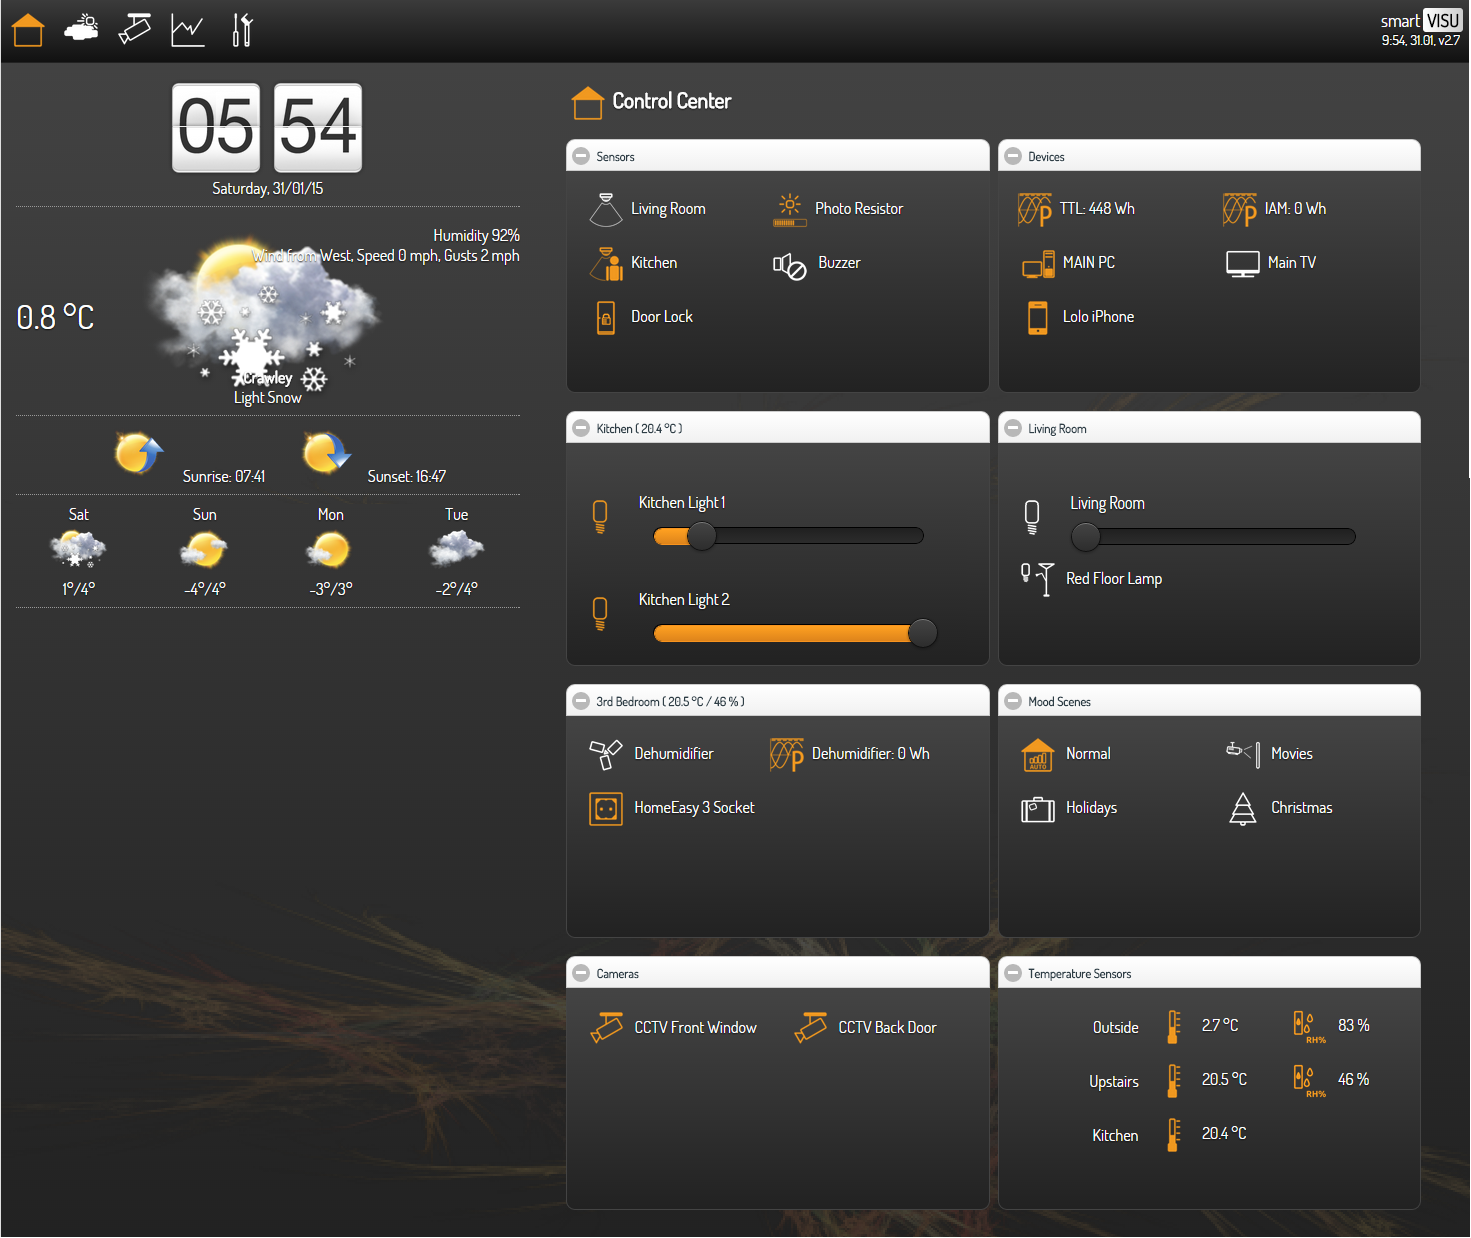
With the recent additions of the RFXtrx, the LightWaveRF switches, the HomeEasy Remote Controlled sockets and the CurrentCost energy monitor, I have updated SmartVISU to take full advantage of these devices.
I’ve also updated the original template to use “my own” weather satellite images (as opposed to the original German ones):
OK I can make the buzzer beep if I forget the lights at night (see code from this post).
But that’s a little bit reactive, and still requires me to “move” and manually switch the light off. What would be better would be to switch the lights off altogether without requiring me to lift a finger.
This is where LightWaveRF comes into play. Not only they look really sleek, they fit in a standard connection box and are relatively cheap (when comparing with other standards).
I therefore bought a couple: 1 x 1 gang for the living room, 1 x 2 gang for the kitchen:
LightWaveRF 1 Gang Switch
LightWaveRF 2 Gang Switch
The way I chose to control them is to pair them with an RFXtrx transceiver via DomotiGa (see this post for more info).
I’ve still got to install the kitchen switch, but for now, I can control the living room lights from anywhere in the world !
I’ve also got some dimmable LEDs, but it turns out I can only dim them down to 50% instead of 0% (not much difference to be honest) so I might be looking for better ones soon. Watch this space 🙂
At the time I did notice the socket underneath, but never got round to getting a cable and software to take full advantage of its use.
After the initial novelty (seeing on a screen how much energy I was using), I ended up putting it in a cupboard.
However since I started using DomotiGa for my home automation setup, and since it appeared to be supported, I started to think about it again. I eventually sourced a cable (HERE)
CurrentCost USB Cable
The setup with DomotiGa was fairly painless: after enabling the CurrentCost energy monitor option and selecting the correct ttyUSB, the data was captured, namely current consumption, max consumption and temperature.
I added this straight away to my SmartVISU page 🙂 :