DomotiGa was upgraded over the Easter weekend as well as a new version of SmartVISU bringing an improvement on plots.
Whereas before the plot function would pull the complete list of values to build the chart (and therefore would just time out, especially with my CurrentCost power consumption as it updates every 5 sec), the revised version has a new parameter for the maximum number of points to return.
This means I can now plot ANY of my devices’ values:
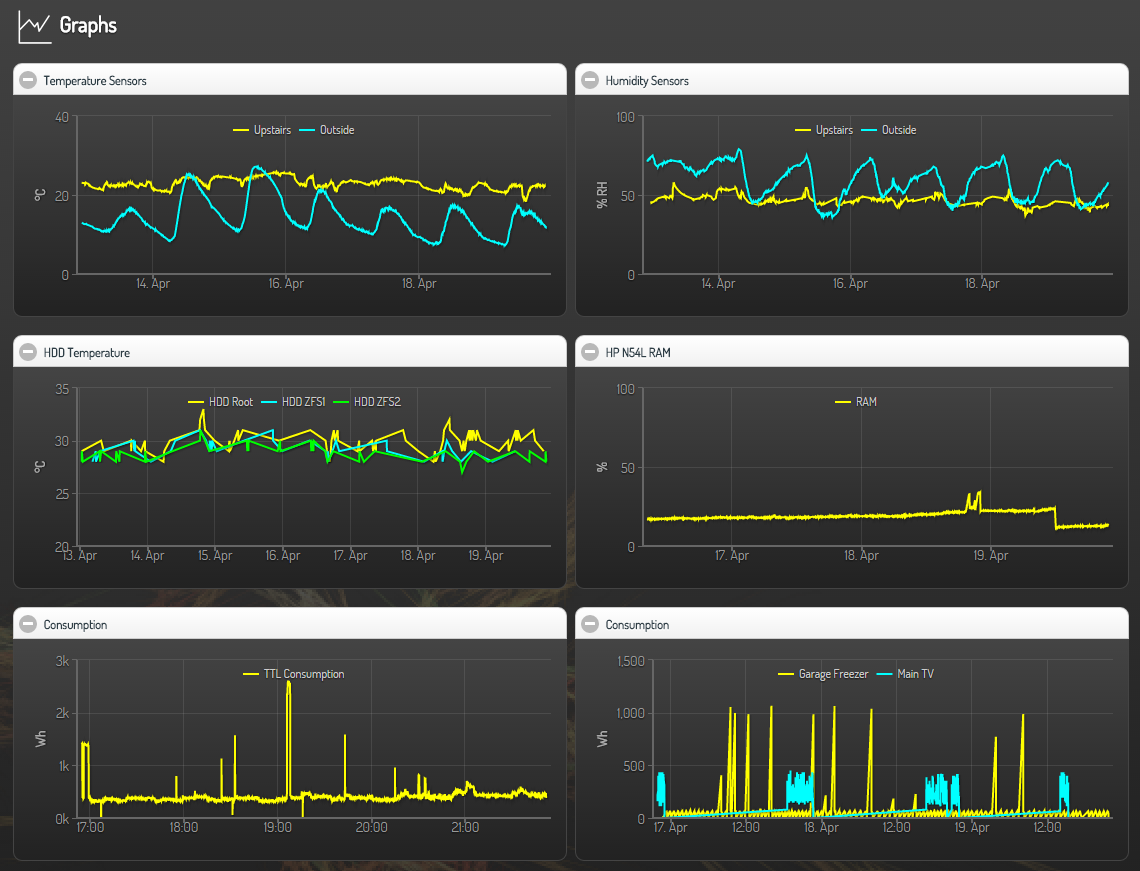
SmartVISU Plots
The easiest way to know where to put that new value (mine’s set to 2500 as any higher seems to time out) is to open widgets\plot.html
/**
* A simple widget for plotting charts
*
* @param unique id for this widget
* @param series of item/s. More item/s in array form: [ item1 , item2 ]
* @param the mode: 'avg', 'sum', 'min', 'max'
* @param the minimum time (x-axis): '1h', '2h'... (duration-format)
* @param the maximum time (x-axis): '', '1h', '2h'... (duration-format, default: now)
* @param the minimum y-axis (optional)
* @param the maximum y-axis (optional)
* @param the number of points in the period
* @param label/s for each series (optional)
* @param color/s for each series e. g. '#f00' for red (optional, default: sutiable for design)
* @param type/s for each series: 'line', 'stair', 'spline', 'area', 'areaspline', 'column' (optional, default 'line')
* @param title/s for the x-axis and y-axis
* @param minimum time while zooming in sec (optional, duration-format)
* @param number of samples (points) (optional, default 100)
*
* @see misc/fundamentals#Array-Form
* @see misc/fundamentals#Duration-Format
*/